
Ecommerce Search Analytics: 10 Metrics That Reveal Revenue Leaks
By Seekora Editor
May 27, 2026
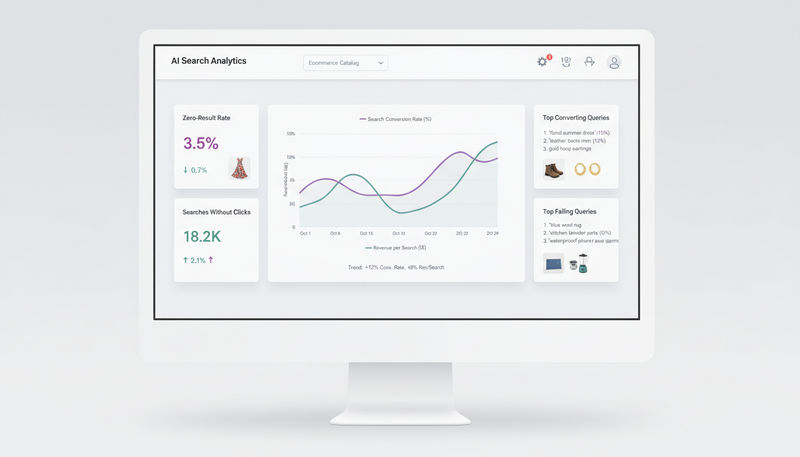
Ecommerce search analytics is the closest thing to a real-time voice-of-customer feed a store has. Every query is an explicit statement of intent, and every zero-result page, abandoned session, or unclicked result is a missed sale that the rest of the analytics stack rarely catches. Yet most stores still treat site search as a UX feature, not a revenue channel. They watch top searches, ignore the rest, and never connect search behavior to conversion or revenue. That blind spot is expensive. Searchers across most verticals convert at multiples of non-searchers and add to cart at significantly higher rates, which means a percentage point of improvement on search conversion almost always pays for the optimization work that produced it. This guide breaks down the ten ecommerce search metrics worth tracking, with formulas, benchmarks, warning signs, and the actions that move each one.
Why Site Search Analytics Belongs in the Revenue Stack
Search queries are the highest-fidelity intent signal an ecommerce site can capture. Unlike scrolls, dwell time, or even category clicks, a typed query is a direct request. A shopper does not type "oversized denim jacket" to browse — they type it because they have decided to look for one.
That is why site search analytics, done correctly, becomes a revenue function and not a UX side project. Search KPIs show which queries convert, which fail, where shoppers leak out of the funnel, and what product, content, or merchandising gaps need to close. The teams who measure search seriously consistently uncover synonym gaps, weak product data, broken filters, and missed recommendation opportunities — all of which translate directly into recovered conversions.
The rest of this guide is the metric set that exposes those leaks, plus the workflow to act on them.
The 10 Ecommerce Search Analytics Metrics That Matter
1. Search usage rate
Formula: sessions with a search / total sessions × 100.
What it tells you: how many shoppers rely on search rather than navigation. Verticals like electronics, fashion, and B2B routinely sit at 25–40%. Below 10% is either low intent traffic or a hidden search bar.
Warning sign: sub-5% usage on a large catalog. Search is buried or shoppers do not trust it.
Fix: make the search bar more visible, persistent across pages, and prominent on mobile.
2. Search conversion rate
Formula: orders from search sessions / total search sessions × 100.
What it tells you: whether the search engine is delivering relevant results to high-intent visitors. This should run two to five times higher than site-wide conversion rate.
Warning sign: search conversion at or below site-wide conversion rate.
Fix: audit relevance for top queries, tune synonyms, review ranking signals, and reduce zero-result pages.
3. Search revenue contribution
Formula: revenue from search sessions / total revenue × 100.
What it tells you: the share of GMV that depends on search. In categories with deep catalogs this is often 30–60%.
Warning sign: search revenue contribution far below search usage rate — search visitors are arriving but not converting.
Fix: investigate result quality and product-data gaps for the highest-traffic queries.
4. Search click-through rate (CTR)
Formula: result clicks / search results impressions × 100.
What it tells you: whether shoppers find a compelling result on the search results page.
Warning sign: CTR below 30% on torso queries. Images, prices, badges, or ranking are off.
Fix: improve product imagery and titles, push best-sellers higher, fix low-quality thumbnails, and check filter defaults.
5. Zero-result rate
Formula: searches that returned zero results / total searches × 100.
What it tells you: how often shoppers ask for something the catalog cannot match. Aim for below 5%.
Warning sign: zero-result rate above 8–10%, especially on head queries.
Fix: address synonyms, typo tolerance, product attribute coverage, and fallback recommendations on zero-result pages. The zero-search-results UX guide covers tactics in detail.
6. Searches without clicks
Formula: searches with zero clicks on any result / total searches × 100.
What it tells you: results were returned but none looked good enough to investigate. This is more damaging than a zero-result page because the catalog had products and still lost the shopper.
Warning sign: above 20% no-click rate on commercial queries.
Fix: check ranking quality, refresh thumbnails, surface social proof, and review whether the engine ranked the wrong category.
7. Search abandonment rate
Formula: search sessions that ended without a product page view / total search sessions × 100.
What it tells you: how often a search session dies on the results page.
Warning sign: above 35% abandonment on top queries.
Fix: add filter chips, recommended categories, recommended products, and "did you mean" suggestions.
8. Revenue per search session
Formula: revenue from search sessions / search sessions.
What it tells you: the cash value of every search that happens on the site. Lets teams compare the dollar impact of two ranking algorithms, not just CTR.
Warning sign: flat or declining trend while search traffic climbs.
Fix: A/B test ranking changes, personalize search results, and run cross-sell modules on the results page.
9. Top converting queries
Formula: rank queries by search-attributed revenue or conversion rate.
What it tells you: which queries drive the most revenue today. These deserve heavy merchandising attention and protected ranking.
Warning sign: the top 20 converting queries have unstable rankings week over week.
Fix: pin or boost critical products, monitor for cannibalization, and protect head queries through A/B tests before any large change.
10. Top failing queries
Formula: queries with high frequency but low CTR, low conversion, or zero results.
What it tells you: the demand the catalog is failing to serve. The single highest-ROI metric for merchandising teams.
Warning sign: the same queries appear week after week with no fix shipped.
Fix: add synonyms, fix attributes, source new products, or build content/landing pages for genuine demand gaps.
A Practical Search Analytics Dashboard Layout
A usable dashboard needs five columns: the metric, the formula, what it tells the team, the warning sign, and the action. Without the action column the dashboard turns into wallpaper.
| Metric | Formula | What it tells you | Warning sign | Optimization action |
|---|---|---|---|---|
| Search usage rate | Sessions with search ÷ total sessions | Search dependence | Below 5% | Increase search bar visibility |
| Search conversion rate | Search orders ÷ search sessions | Relevance quality | At or below site CVR | Tune synonyms and ranking |
| Search revenue share | Search revenue ÷ total revenue | Search's revenue weight | Far below usage rate | Fix attributes and product data |
| Search CTR | Result clicks ÷ result impressions | Result appeal | Below 30% on torso queries | Improve thumbnails and ranking |
| Zero-result rate | Zero-result searches ÷ total searches | Catalog coverage | Above 8–10% | Add synonyms, typo tolerance |
| Searches without clicks | No-click searches ÷ total searches | Result quality | Above 20% on commercial queries | Review ranking, add filters |
| Search abandonment | Search sessions without PDP view ÷ search sessions | Funnel leak | Above 35% on top queries | Add did-you-mean and chips |
| Revenue per search session | Search revenue ÷ search sessions | Dollar value per search | Flat while traffic grows | A/B test ranking, personalize |
| Top converting queries | Rank by revenue or CVR | Where to defend | Volatile rankings | Pin, boost, protect with tests |
| Top failing queries | High volume, low CTR/CVR/zero result | Demand gaps | Repeats week over week | Fix synonyms, attributes, gaps |
Assign every row to an owner. Without that, the dashboard never converts to action.
A Weekly Search Optimization Workflow
The most underrated investment in ecommerce search is a recurring weekly cadence. Five days, five focused jobs:
- Monday — review top failing queries. Pull the top 20 zero-result and no-click queries from the previous week. Flag the ones with measurable search volume.
- Tuesday — fix synonyms and attributes. Add the synonyms the failing queries imply. Backfill missing product attributes (material, fit, gender, color, use case) that the engine needs to rank.
- Wednesday — adjust merchandising. Update pinned products, boosts, and category landing pages for queries the catalog now serves better.
- Thursday — test recommendations. Review which results pages convert below benchmark and add recommendation modules, related products, or did-you-mean suggestions.
- Friday — measure impact. Pull conversion rate, zero-result rate, and revenue per search for the queries touched on Tuesday and Wednesday. Document what shifted.
This workflow takes a couple of hours per day and compounds quickly. Within a quarter, the same top failing queries no longer appear on Monday's report.
Common Mistakes Merchandising Teams Make
Five recurring patterns that flatten search analytics ROI:
- Tracking only top searches. The top 20 queries usually convert fine. The next 200 are where most revenue is leaking.
- Ignoring no-click searches. A search that returns results and gets no click is a stronger relevance signal than a zero-result query, and most teams never look at it.
- Not segmenting by device, category, or campaign. Mobile and desktop behave differently. Paid traffic queries differ from organic. Averaging across all of it hides the real problems.
- Failing to tie search to revenue. Reporting only on CTR or top terms leaves search disconnected from finance. Always report search revenue contribution alongside relevance KPIs.
- Optimizing without A/B testing. Ranking changes feel like improvements until measured. Without a control group, regressions hide.
Avoiding these mistakes is the difference between search analytics that informs strategy and dashboards that get ignored.
FAQs About Ecommerce Search Analytics
What is the most important ecommerce search analytics metric?
Search revenue contribution. It frames every other metric in dollar terms and gets executive attention, which unlocks budget for relevance work.
What is a good zero-result rate for an ecommerce site?
Below 5% is healthy. 5–8% is a clear improvement opportunity. Above 8–10% means synonyms, attribute coverage, or typo tolerance are leaking measurable revenue.
How is search conversion rate different from site conversion rate?
Search conversion rate measures shoppers who used the search bar. It is consistently two to five times higher than site-wide conversion because typing a query signals strong intent.
What are "searches without clicks" and why do they matter?
Queries that returned results but where the shopper clicked nothing. They reveal ranking quality and product appeal problems that zero-result analytics misses entirely.
How often should an ecommerce team review search analytics?
Weekly for top queries and failing queries, monthly for trend reporting, and quarterly for big strategic shifts like ranking algorithm changes or replatforming.
Wrapping Up: How Seekora Surfaces and Closes Search Revenue Leaks
The ten metrics in this guide are not new — they have been the right ones for years. What changes is how easy or hard a stack makes them to track. Generic web analytics tools were never built for site search, which is why most stores see top searches but never connect a query to revenue, never see no-click queries, and never get an action recommended next to a metric.
Seekora's analytics dashboard was built around this metric set. It tracks search usage, conversion, revenue contribution, zero-result rate, no-click queries, top converting and top failing queries in one place, with query-level breakdowns and segmentation by device, category, and campaign. The platform also surfaces the action — synonym gaps, attribute gaps, recommendation opportunities — alongside the metric, so merchandising teams stop hunting for what to fix and start shipping fixes. If the goal is to turn search analytics into a recurring revenue lift rather than a quarterly dashboard exercise, that is the workflow Seekora is designed to support.
Ecommerce Search Analytics: 10 Metrics That Reveal Revenue Leaks
- Why Site Search Analytics Belongs in the Revenue Stack
- The 10 Ecommerce Search Analytics Metrics That Matter
- 1. Search usage rate
- 2. Search conversion rate
- 3. Search revenue contribution
- 4. Search click-through rate (CTR)
- 5. Zero-result rate
- 6. Searches without clicks
- 7. Search abandonment rate
- 8. Revenue per search session
- 9. Top converting queries
- 10. Top failing queries
- A Practical Search Analytics Dashboard Layout
- A Weekly Search Optimization Workflow
- Common Mistakes Merchandising Teams Make
- FAQs About Ecommerce Search Analytics
- What is the most important ecommerce search analytics metric?
- What is a good zero-result rate for an ecommerce site?
- How is search conversion rate different from site conversion rate?
- What are "searches without clicks" and why do they matter?
- How often should an ecommerce team review search analytics?
- Wrapping Up: How Seekora Surfaces and Closes Search Revenue Leaks

Stay ahead of the curve.
Subscribe to get the latest e-commerce insights and AI strategies delivered directly to your inbox.